Introduction
As of 2024, the cryptocurrency market has seen significant fluctuations, with Bitcoin price changes drastically affecting traders and investors alike. With over $4.1 billion lost to DeFi hacks in 2024 alone, the need for effective trading tools is more critical than ever. One such tool is the Bollinger Bands indicator, which allows traders to analyze Bitcoin price movements and make informed decisions.
In this article, we will explore what Bollinger Bands are, their historical significance in Bitcoin price analysis, and how you can leverage them effectively to refine your trading strategy. We’ll also highlight the growth of cryptocurrency adoption in Vietnam, showcasing how local investors can benefit from these techniques.
Understanding Bollinger Bands
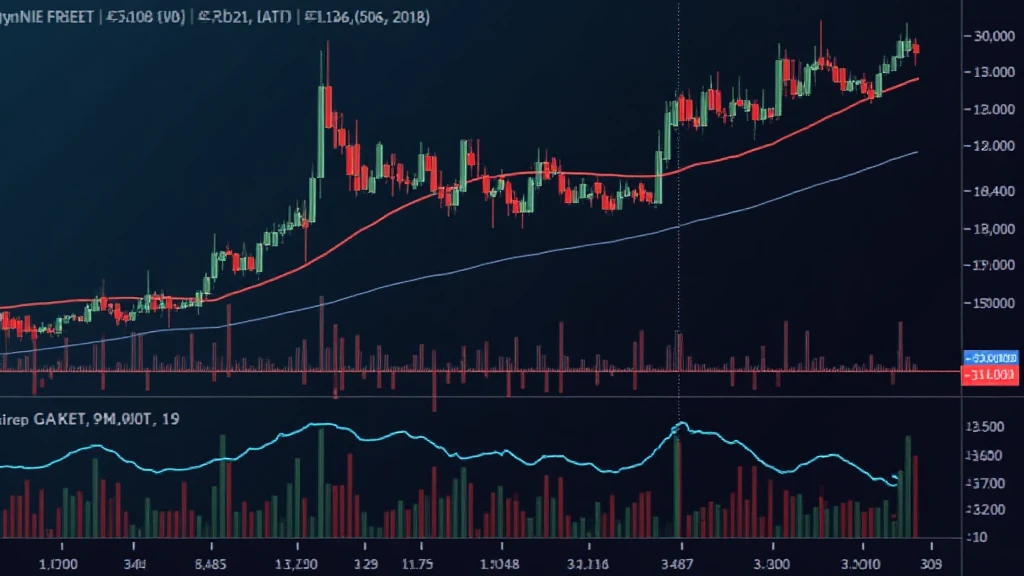
Bollinger Bands were created by John Bollinger in the 1980s as a way to measure market volatility and identify overbought or oversold conditions. The indicator consists of three lines: a simple moving average (SMA) in the center, and two outer bands that are two standard deviations away from the SMA. Here’s how it works:

- Middle Band: This is usually the 20-day SMA, which provides a basis for the outer bands.
- Upper Band: This band signifies overbought conditions when the price hits or exceeds this band.
- Lower Band: Conversely, this band indicates oversold conditions when the price dips below it.
Understanding these components allows traders to identify price trends and make predictions about future movements.
The Importance of Volatility
Volatility plays a central role in trading, especially for assets like Bitcoin. High volatility can lead to rapid price movements, which can be risky if not managed properly. Here’s a simplified analogy: imagine a rubber band; the more you stretch it, the more tension it holds. In trading, as market conditions change, prices may react much like that rubber band. Bollinger Bands help visualize that tension.
In the context of Bitcoin, here are some pertinent statistics:
- Bitcoin experienced a volatility index of 76% in 2023.
- Analysis from Blockchain.com indicates that Bitcoin’s price moved over 30% in a single week on several occasions last year.
Analyzing Bitcoin Price with Bollinger Bands
Now that we understand the theory behind Bollinger Bands, let’s dive into how to best use them in Bitcoin price analysis.
Identification of Market Trends
Using Bollinger Bands effectively requires not only identifying the bands but also understanding their implications. Traders often look for specific patterns:
- Squeezes: When the bands come close together, it indicates a period of low volatility, often preceding significant price changes.
- Breakouts: A price breakout above the upper band suggests a possible upward trend, while a breakdown below the lower band indicates a potential downward trend.
For instance, a recent trend showed that when Bitcoin’s price breaks above the upper band, it often led to significant upward movement. This repeated scenario is akin to seeing the race signals at a starting line: waiting for the green means it’s time to go!
Setting Your Trading Strategy
For traders, having a clear strategy is vital. Here’s a simplified approach to using Bollinger Bands for Bitcoin:
- Setting Time Frames: Many traders prefer using daily charts for a medium to long-term strategy, while short-term traders often focus on 1-hour or 4-hour charts.
- Entry and Exit Points: Consider entering a position when price touches the lower band and exiting when it hits the upper band. This strategy assumes reversion to the mean.
- Combining with Other Indicators: Enhance your analysis by incorporating other indicators like RSI or MACD to confirm signals.
The integration of these indicators can provide a comprehensive view of market conditions.
Case Study: Bitcoin’s Volatile Patterns
Let’s apply these concepts to real-world data. In March 2024, Bitcoin experienced a notable surge, exceeding $70,000 after a series of squeezes occurred on the Bollinger Bands chart.
| Date | Price | Action |
|---|---|---|
| March 1 | $60,000 | Price touches lower band |
| March 15 | $65,000 | Price breaks upper band |
| March 30 | $70,000 | Price stabilizes |
This case demonstrates the predictive power of Bollinger Bands. During the squeeze period, traders could anticipate the upcoming trends, enabling them to make informed decisions.
Local Insights: The Vietnam Market
The growth of cryptocurrency adoption in Vietnam is noteworthy. Recent statistics show:
- Vietnam’s cryptocurrency user growth rate skews upwards by 240% from 2022 to 2023.
- Over 30% of Vietnamese internet users are now actively trading cryptocurrencies.
Local traders can use Bollinger Bands to analyze Bitcoin price fluctuations effectively, adapting their strategies to these growing trends.
Practical Tools for Traders
To better engage with Bitcoin trading, consider utilizing these tools:
- TradingView: An excellent platform for real-time analysis and charting.
- Ledger Nano X: A hardware wallet that can help reduce hacks by 70% while securing your assets.
These resources can enhance your trading experience and safeguard your investments.
Conclusion
In summary, analyzing Bitcoin prices using Bollinger Bands is an effective way to navigate the volatile cryptocurrency landscape. With data-driven strategies, local Vietnamese traders can leverage these techniques to make informed decisions. As the market continues to evolve, staying updated with tools and analytics will help you remain ahead of trends.
By utilizing Bollinger Bands judiciously, traders not only better their ability to forecast price movements but also reduce risks associated with trading in the high-stakes world of cryptocurrency.
For those looking to deepen their understanding of Bitcoin price analysis and to stay ahead in the market: officialcryptonews provides the insights and resources you need.
Author: Alex Johnson
Alex is a cryptocurrency trading veteran with over ten years of experience analyzing market trends. He has published over fifty papers on trading strategies and has successfully conducted audits on several prominent blockchain projects.


