Introduction
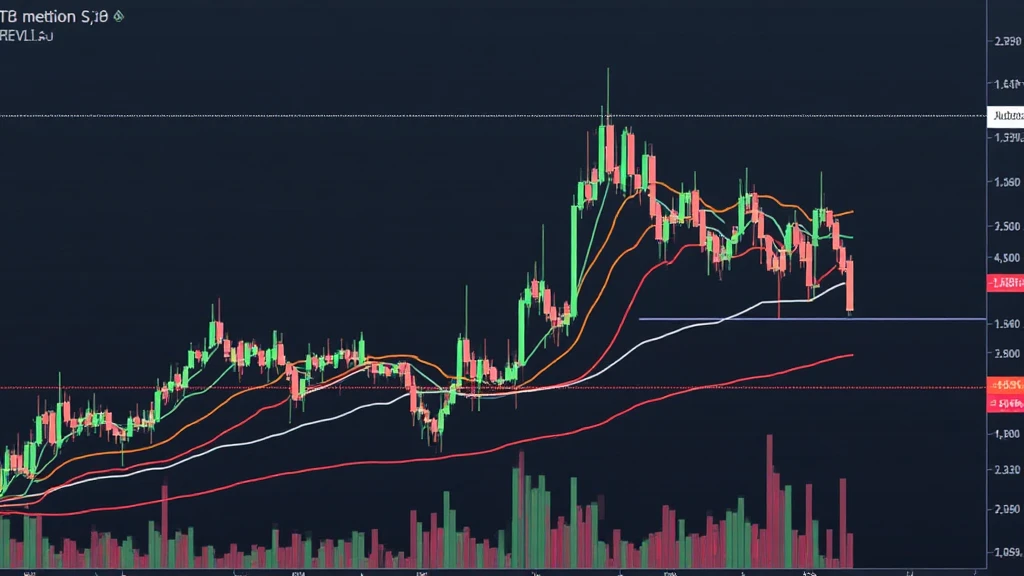
As of 2024, the cryptocurrency market has witnessed fluctuations that challenge even the most seasoned investors. For instance, with an estimated loss of $4.1 billion due to DeFi hacks, understanding market dynamics is essential. One pivotal method that traders utilize to gauge potential price movements is Fibonacci retracement. This article will explore how to effectively apply Fibonacci retracement for Bitcoin price analysis, which can aid traders and investors in making informed decisions.
What is Fibonacci Retracement?
Fibonacci retracement relies on the key Fibonacci sequence, where each number is the sum of the two preceding ones. In trading, key levels derived from this sequence are used by analysts to identify potential support and resistance levels on assets such as Bitcoin. Here’s how the Fibonacci levels typically stack up:
- 0.0%
- 23.6%
- 38.2%
- 50.0%
- 61.8%
- 100%
Unlike traditional methods, Fibonacci retracement does not predict price direction but suggests possible reversal points in the market, which is particularly helpful during volatile market conditions.

How to Implement Fibonacci Retracement in Bitcoin Trading
Implementing Fibonacci retracement for Bitcoin requires a few steps. Here’s a concise approach to effectively apply this technique:
- Identify the trend: Determine if Bitcoin is in an uptrend or downtrend.
- Select significant swing highs and lows: These are points where price action changes direction.
- Draw Fibonacci levels: Use trading software to map Fibonacci levels between your selected swing points.
- Watch for reversal patterns: Observe how price reacts at key Fibonacci levels.
Let’s break this down:
- In an uptrend, start from the low and draw your line to the high.
- In a downtrend, do the opposite. This action provides clearer insight into where the price may find support or resistance.
Real-World Example: Bitcoin’s 2024 Price Movements
By analyzing Bitcoin’s price movements in 2024, let’s consider a scenario where Bitcoin rose from $30,000 to $60,000. If we apply Fibonacci retracement, the swing low is $30,000 and the swing high is $60,000, leading to potential retracement levels:
- 0.0% – $60,000
- 23.6% – $54,292
- 38.2% – $51,180
- 50.0% – $45,000
- 61.8% – $38,820
- 100% – $30,000
Each of these levels provides traders valuable insights. For instance, a bounce from the 38.2% level could indicate that buyers are stepping in, while a breakdown under the 61.8% might lead to further declines.
Benefits of Using Fibonacci Retracement
Fibonacci retracement offers numerous advantages for traders looking to analyze Bitcoin prices:
- Simplicity: The method is easy to understand and can be applied quickly across different trading platforms.
- Universal Relevance: Fibonacci levels are used globally, allowing traders from various backgrounds to analyze price movements effectively.
- Combination with Other Indicators: Fibonacci retracement works well with other technical indicators, enhancing the prospects of accurate predictions.
Drawbacks to Consider
While Fibonacci retracement is a powerful tool, there are also limitations:
- Subjective Lines: Identifying swing highs and lows can be subjective, leading to different levels being drawn by different traders.
- Not Always Accurate: Just because a price approaches a Fibonacci level doesn’t guarantee a reversal.
Bitcoin Price Predictions for 2025: Integrating Fibonacci Analysis
Looking forward to 2025, investors are keen to decipher where Bitcoin could land. Experts suggest employing long-term Fibonacci retracement analysis along with current market trends to forecast price movements.
For instance, if historical Fibonacci levels and ongoing market sentiment align, Bitcoin could see new highs. However, predicting these fluctuations demands an intricate understanding of market variables. Here’s the catch: using this analysis can help manage risks better.
Local Context: Vietnam’s Growing Cryptocurrency Market
Vietnam has emerged as a notable player in the cryptocurrency arena. As of late 2024, user growth in the Vietnam crypto market was estimated at 30% year-on-year. This increasing interest in cryptocurrencies, combined with price analysis tools such as Fibonacci retracement, offers Vietnamese traders a strategic edge.
Conclusion
In this extensive exploration of Bitcoin price analysis using Fibonacci retracement, we uncovered its practical application and importance in today’s dynamic market. As you embark on your trading journey, remember that while Fibonacci levels can guide decision-making, continuous learning and adaptation are vital in this ever-evolving space.
Whether you’re new to cryptocurrency trading or a seasoned investor, leveraging Fibonacci retracement can enhance your analytical skills significantly. As always, consider consulting with local regulators and experts for tailored advice on your trading strategies. Keep in mind that trading involves risks, and historical performance is not indicative of future results.
For more insights into the crypto world, visit us at officialcryptonews. Our platform continues to provide up-to-date information and expert opinions to aid your investment decisions.
Author: Dr. Alex Nguyen, a market analyst with over 15 published papers on cryptocurrency trends and a leading expert in market audits.


